Nota
L'accesso a questa pagina richiede l'autorizzazione. È possibile provare ad accedere o modificare le directory.
L'accesso a questa pagina richiede l'autorizzazione. È possibile provare a modificare le directory.
This article explains how to review code app data requests and responses in browser dev tools.
Browser developer tools (DevTools) are built-in tools in modern web browsers that let you inspect network traffic, view console logs, debug JavaScript, and examine HTML/CSS. You can open DevTools by pressing F12 or Ctrl+Shift+I, or by right-clicking a page element and choosing Inspect (on macOS use Command+Option+I). For detailed guidance, review the browser documentation:
Prerequisites
You have a code app that connects to data as described in these articles:
View data requests in browser dev tools
You can filter data requests using these strings:
| Data source | Filter string |
|---|---|
| Connectors | apihub.net |
| Dataverse | dynamics.com |
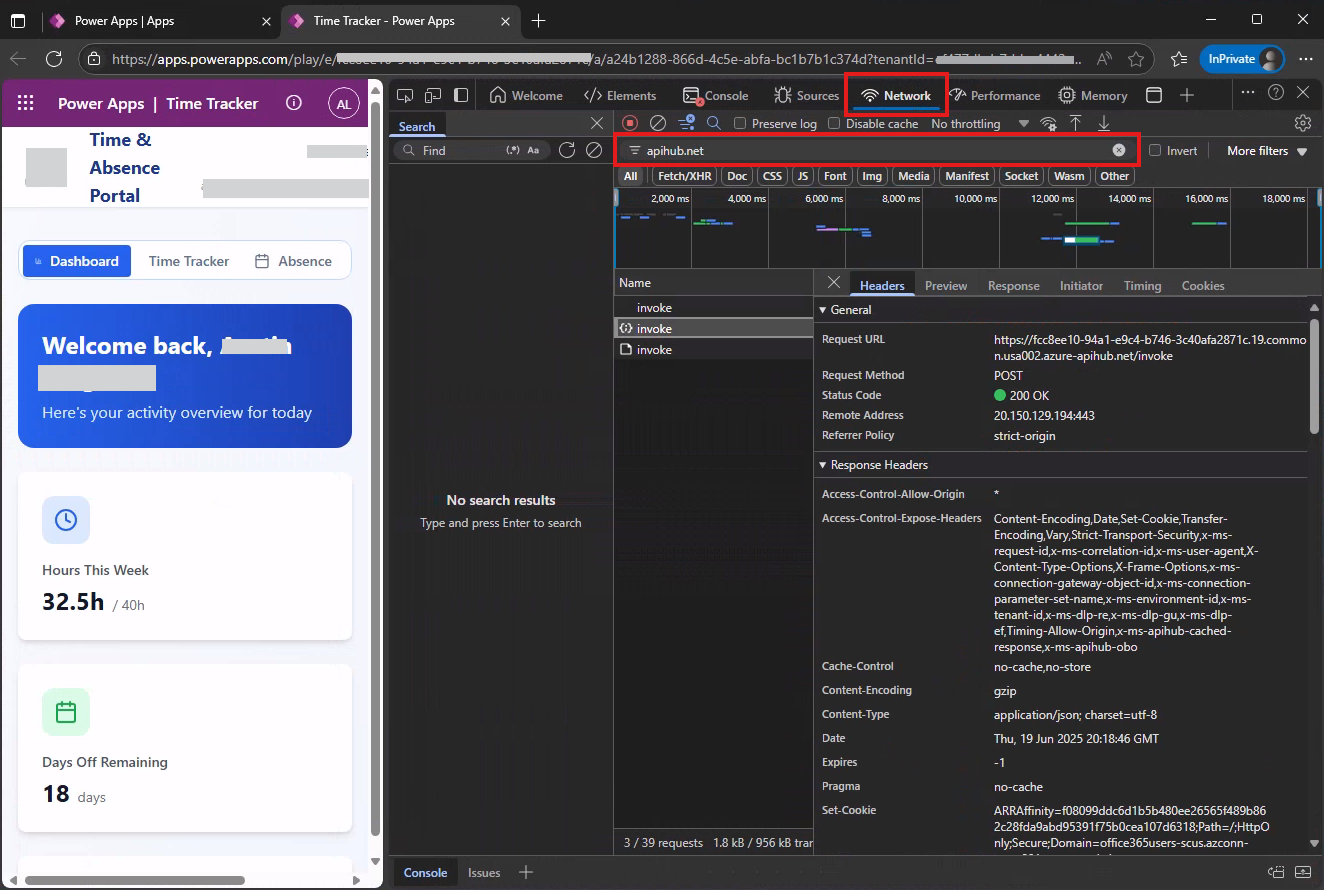
This screenshot shows how to filter requests to connectors using dev tools in Edge using the apihub.net filter.